

In a nutshell:Facts, figures and data
Productivity, efficiency and sustainability are not a matter of faith, but can be clearly proven with hard figures – clearly laid out in black and white. On this page, we have compiled all the facts and data about GMVA for you in a clear format. We don’t find these figures dry or sober, but are proud of what they mean. Not least for the environment and energy supply. But see for yourself!
Production data
| Overview of services | |
|---|---|
| Delivery quantity | 680,000 to 720,000 t/a |
| Vapour generator quantity | 2,200,000 t/a |
| Total electricity generation | 390,000 to 420,000 MWh/a |
| Electricity consumption | 75,000 MWh/a |
| Electrical grid feed | 315,000 to 340,000 MWh/a |
| District heating quantity | 50,000 to 150,000 MWh/a |
| Average waste calorific value | 10,500 kJ/kg |
| Slag quantity | 180,000 t/a |
| Turbine I | Turbine II | |
|---|---|---|
| Max. el. power output | 25.6 MW | 44.9 MW |
| Max. Fresh vapour intake vol. | 117.9 t/h | 190 t/h |
| Max. Condensate quantity | 108 t/h | 190 t/h |
| No. of tappings/taps | 1 | 3 |
Power generation
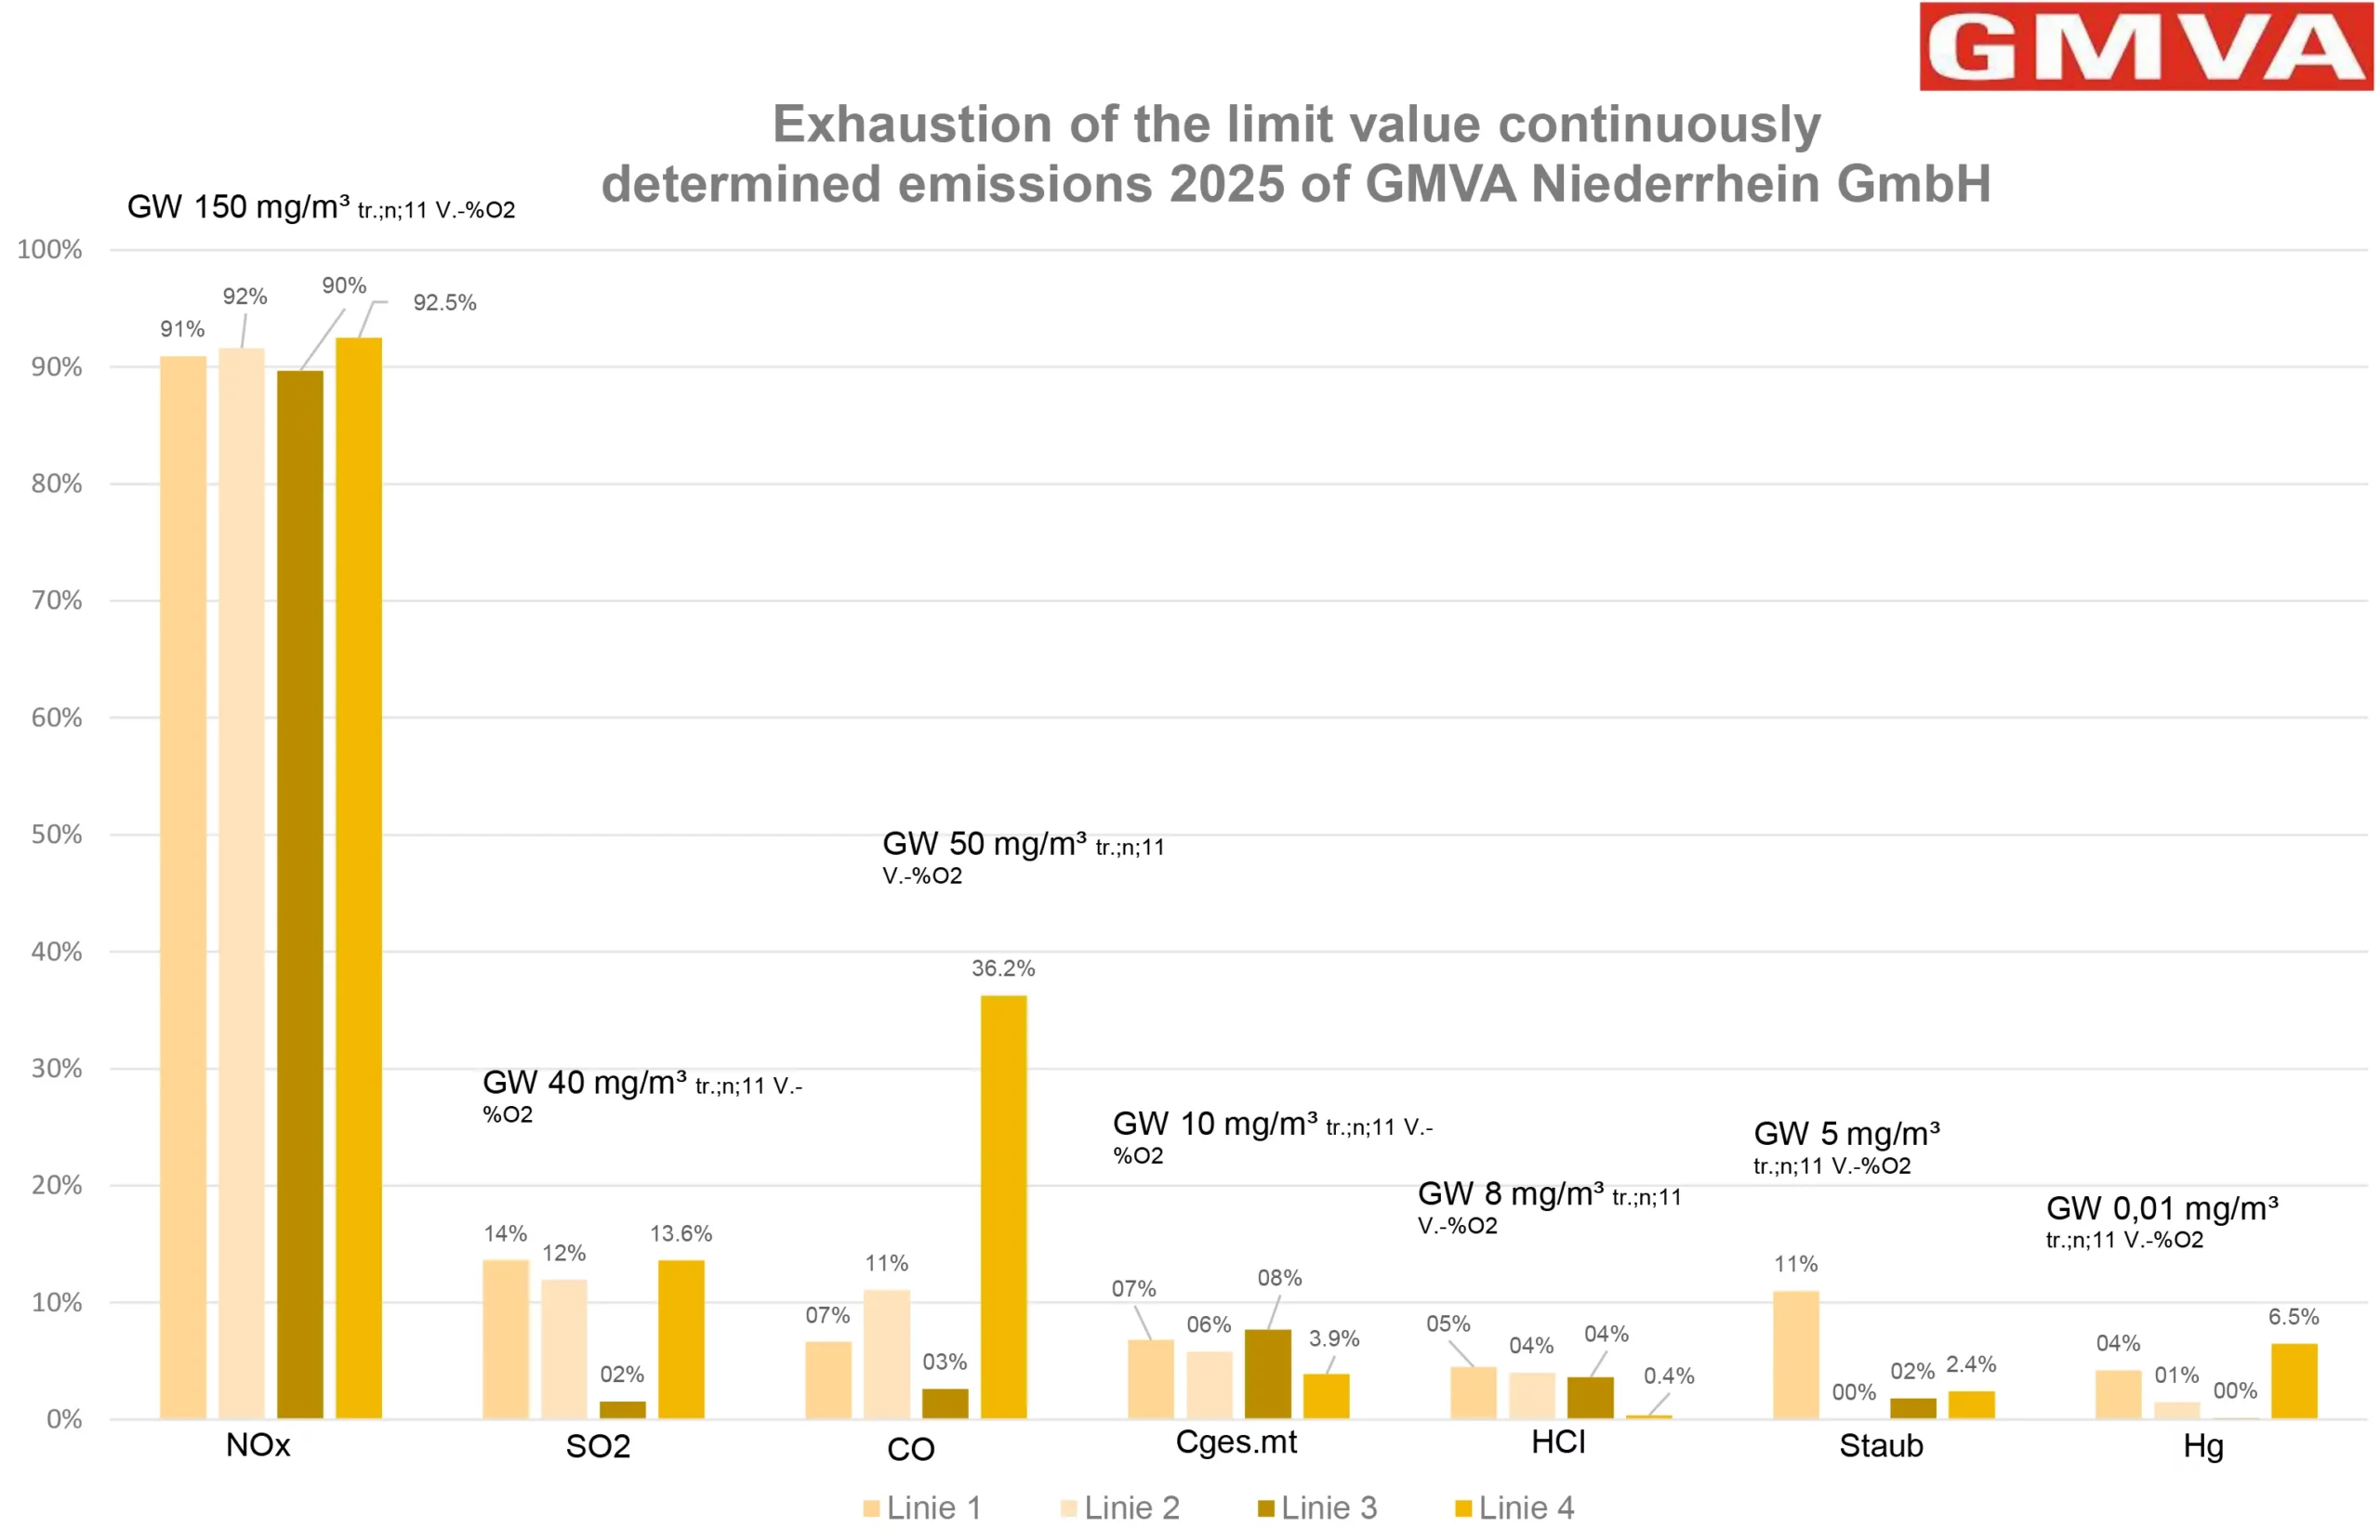
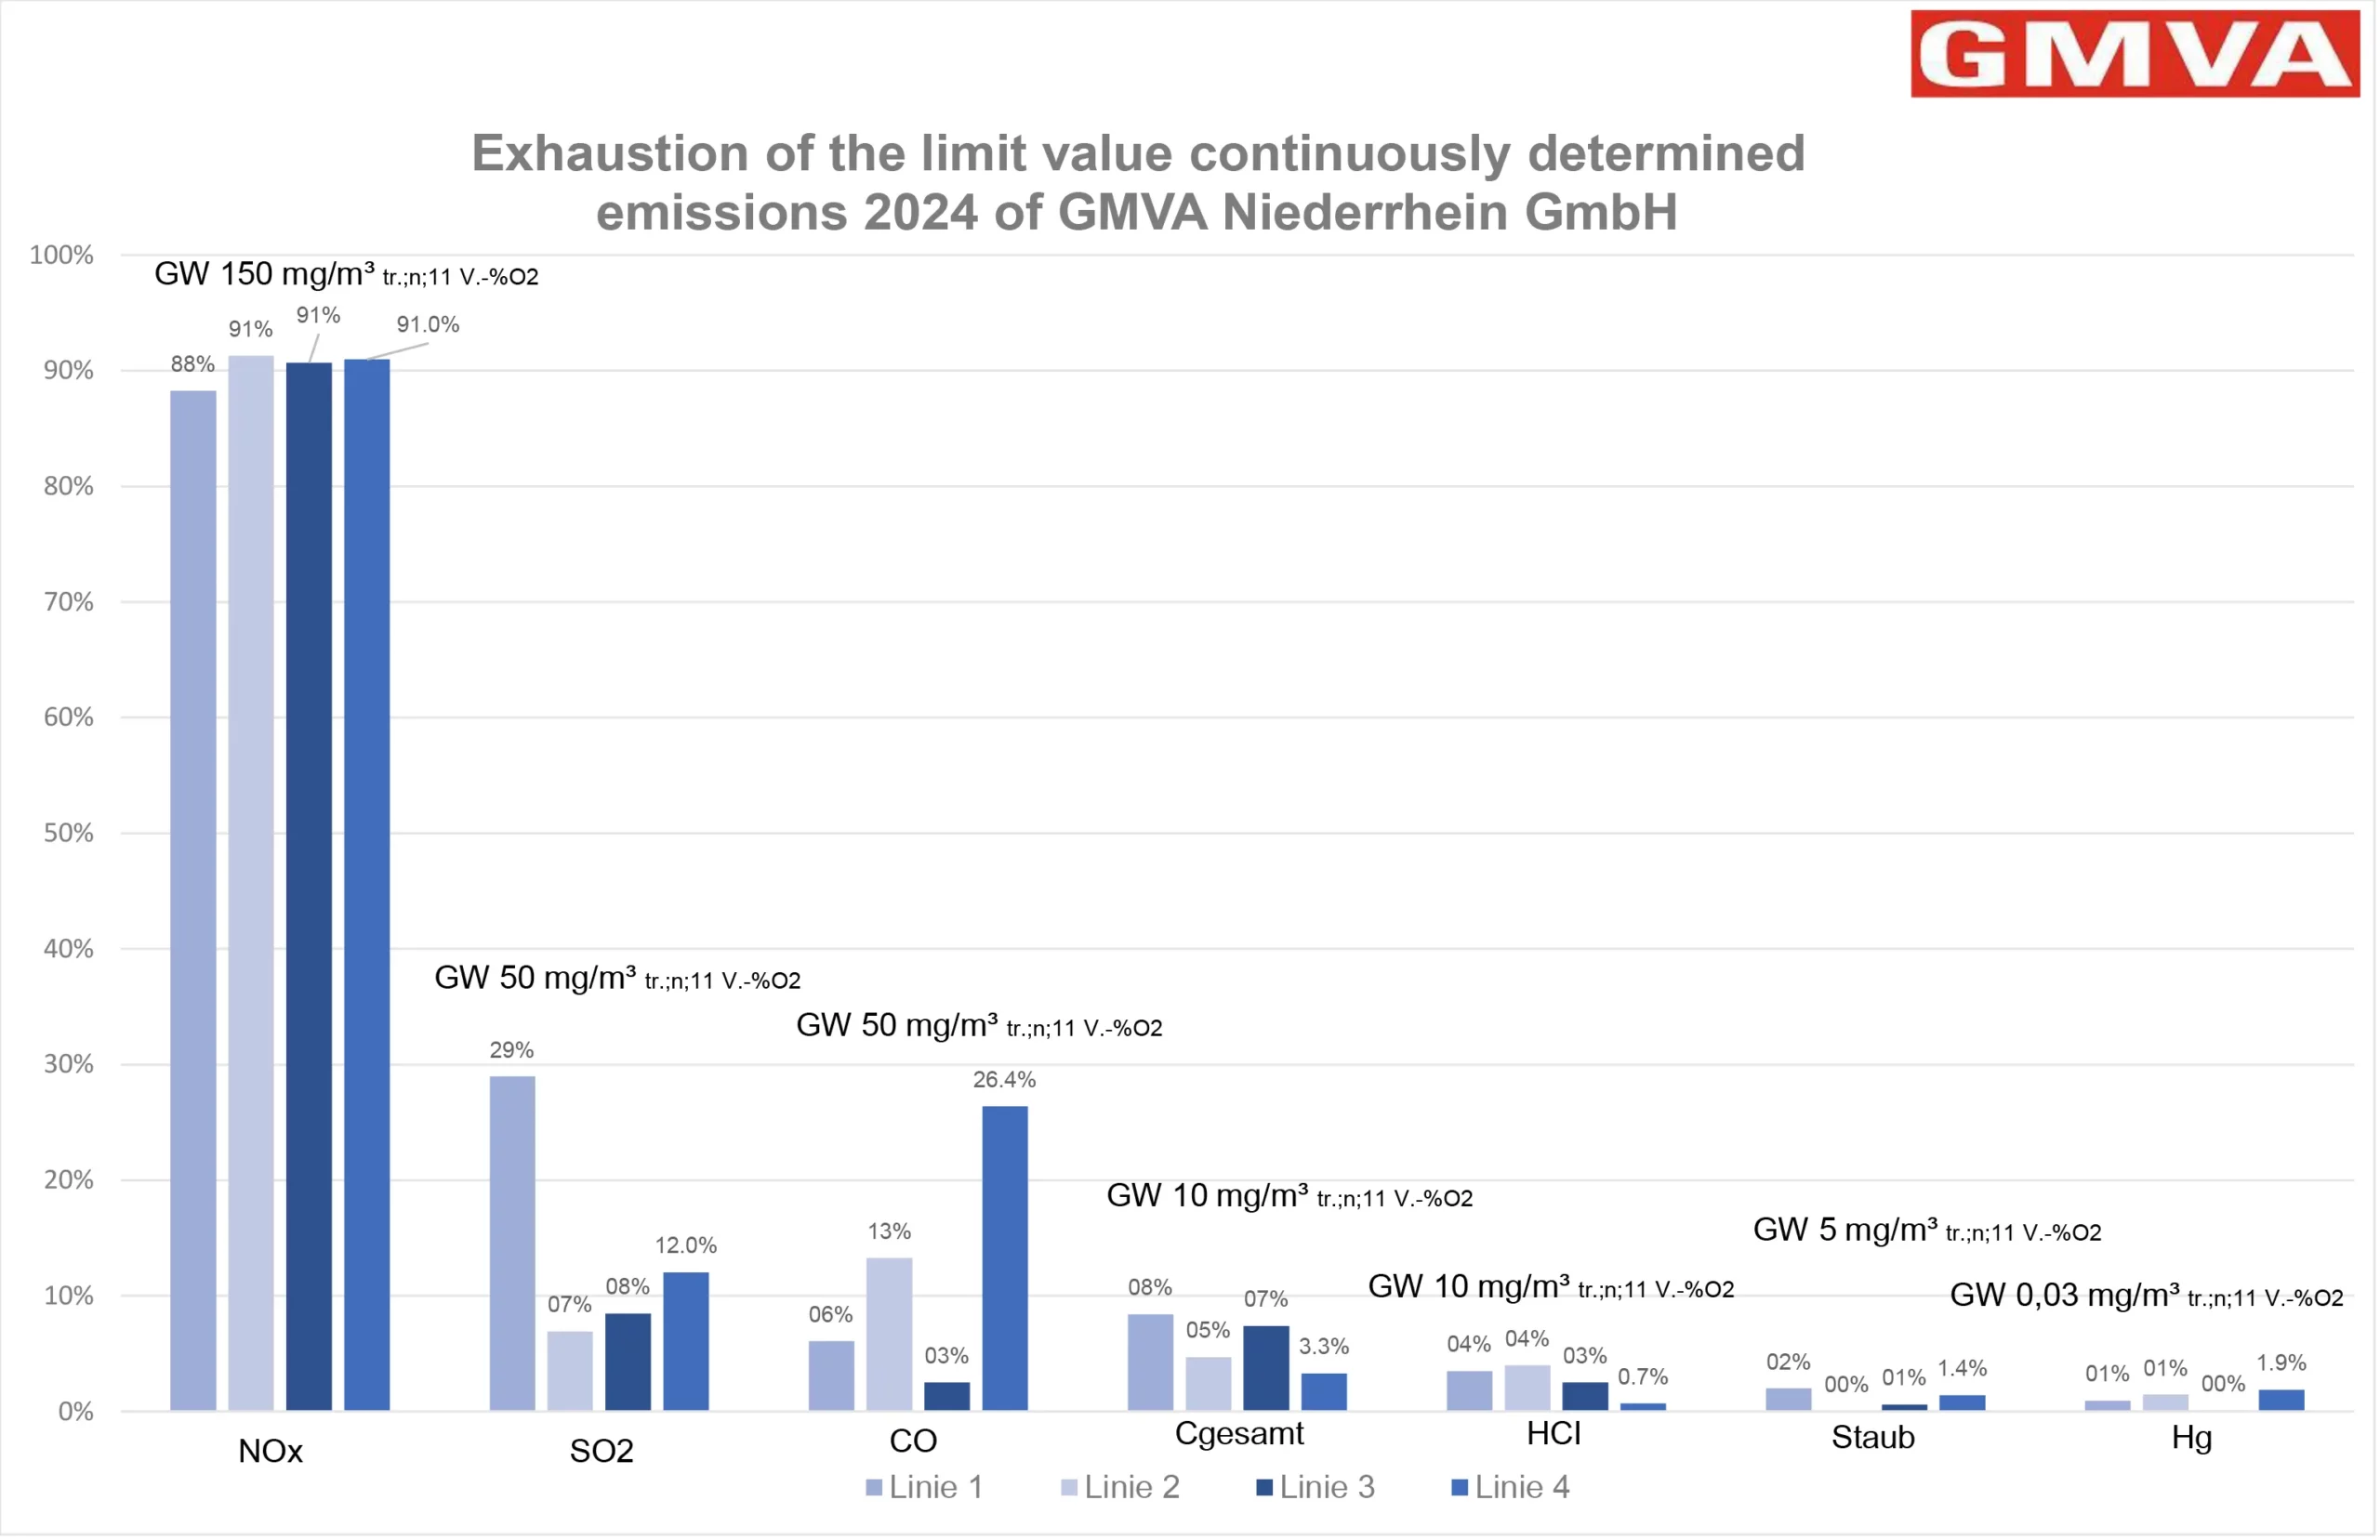
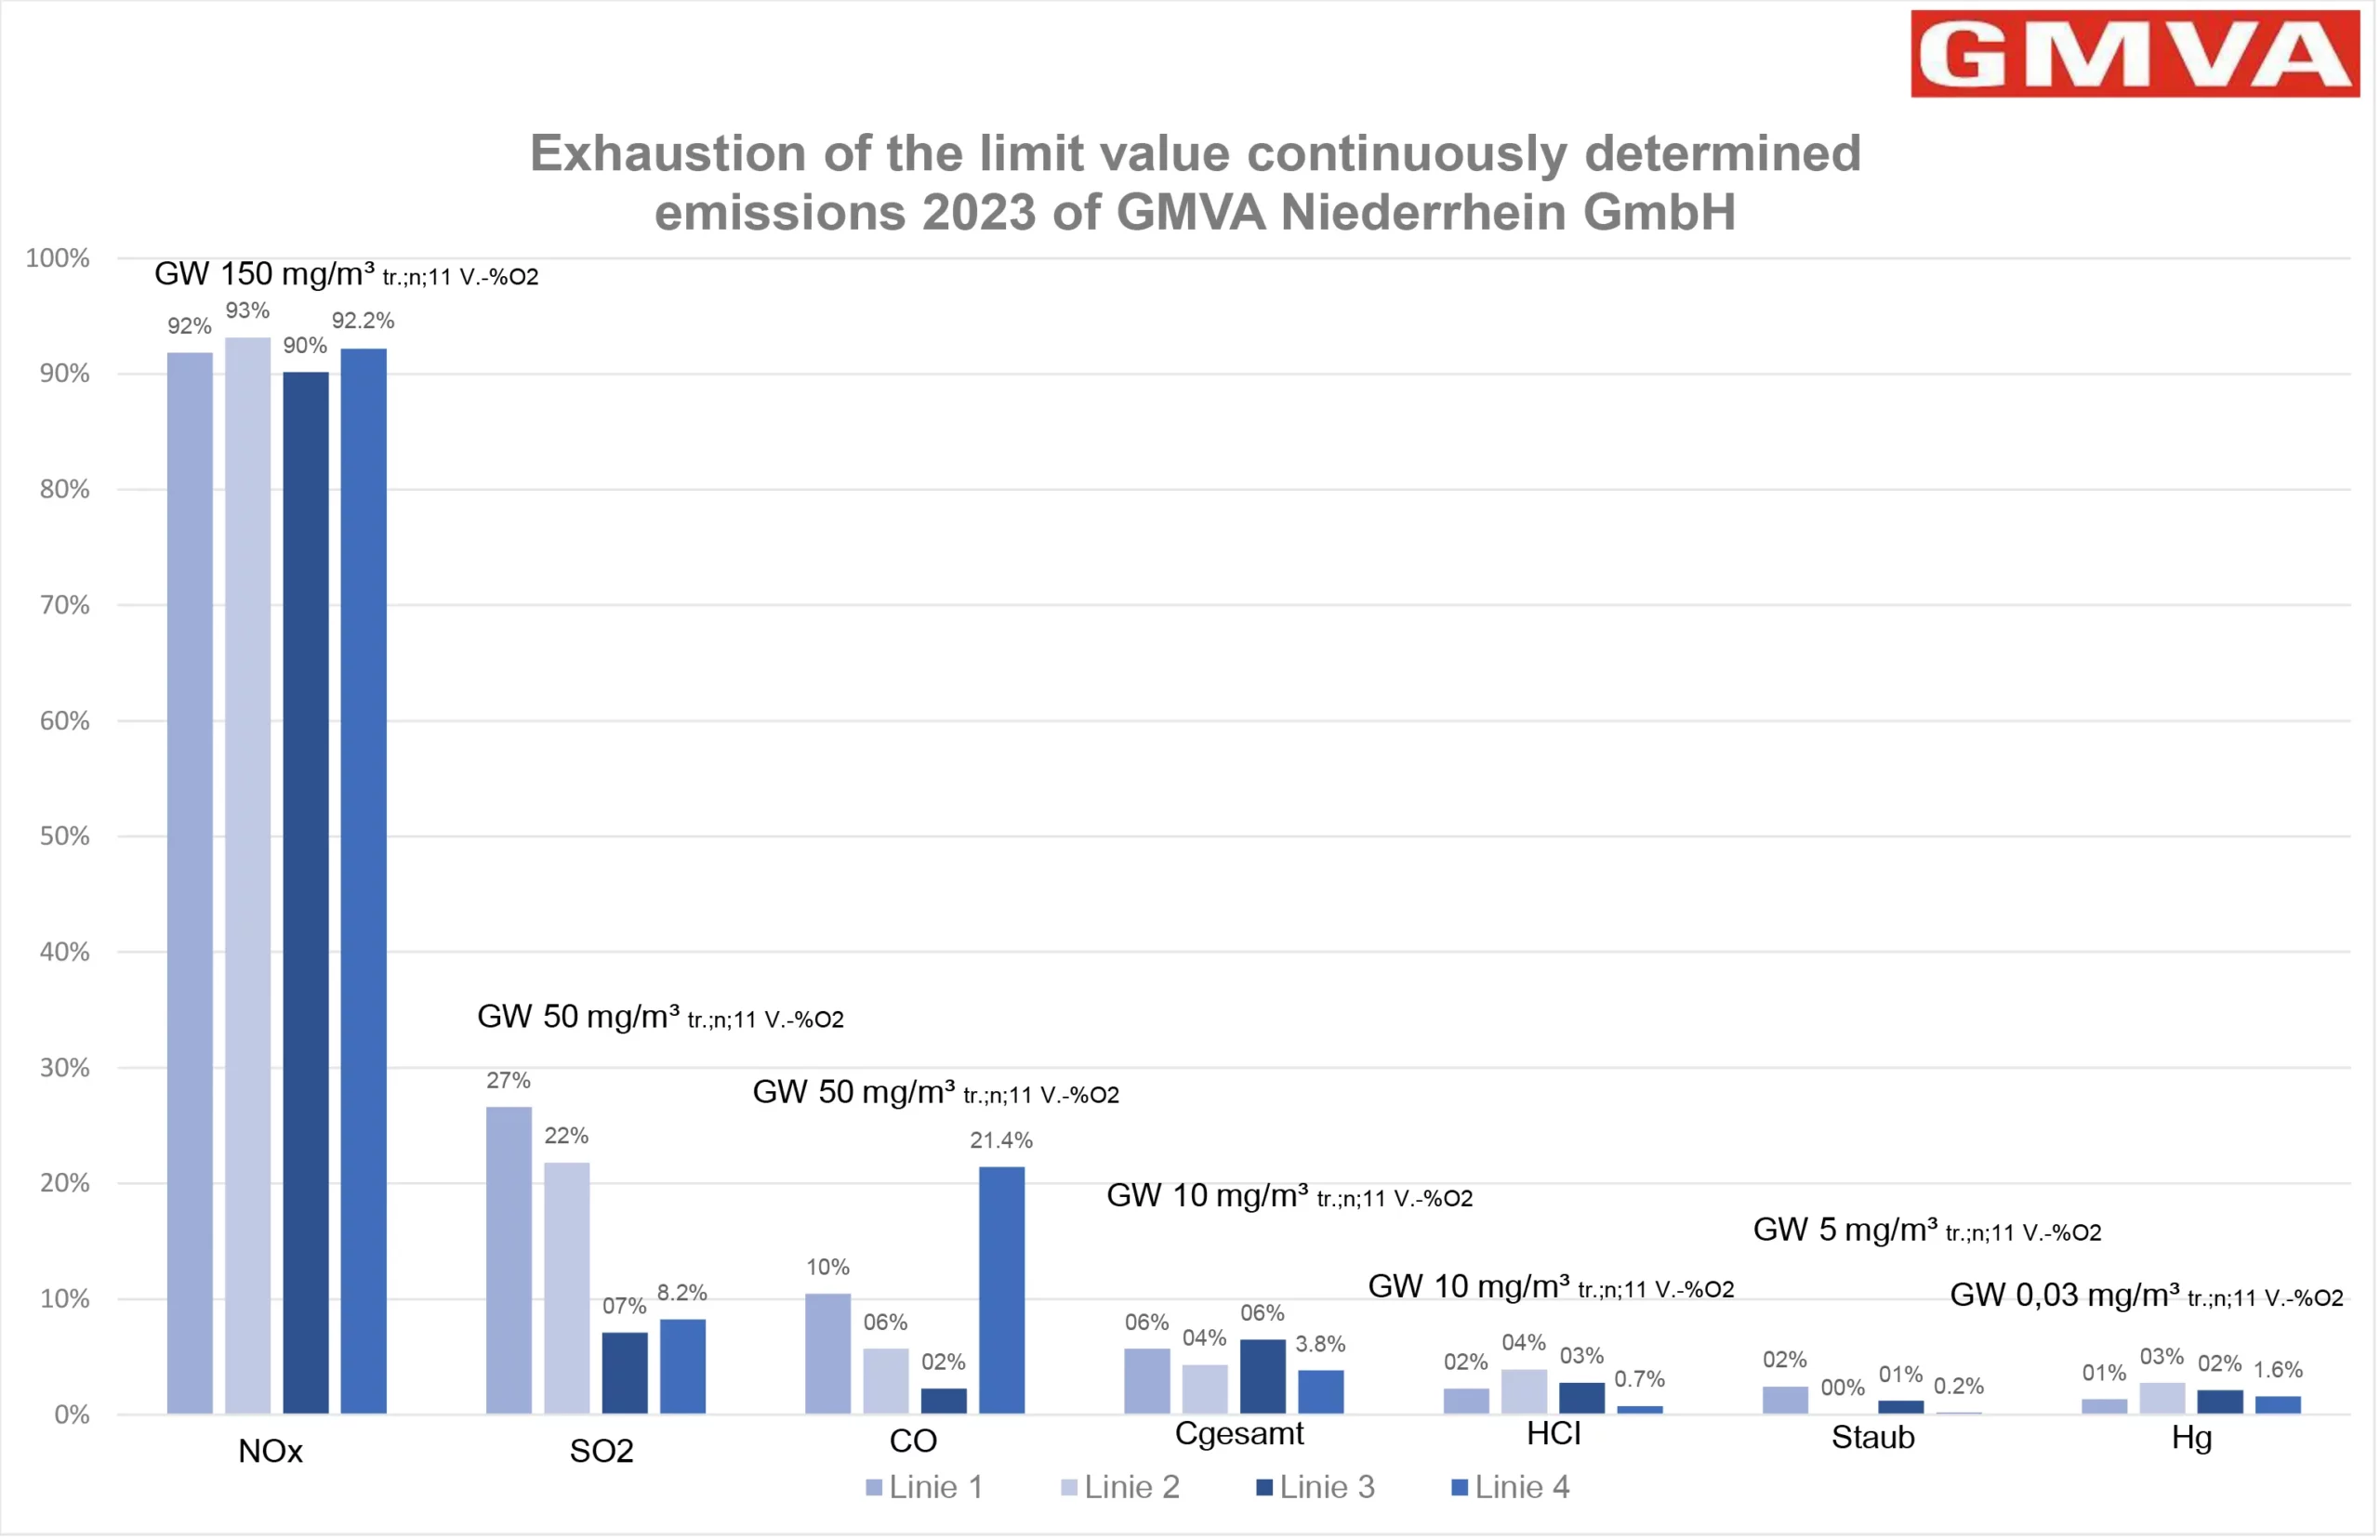
Limit values for emissions
The 17th Ordinance to the Federal Immission Control Act specifies precise limit values for flue gas-side pollutant levels. GMVA falls below every single one of them.
Pollutant emissions compared to the statutory limits.
Emission values Complete overview
According to § 23 of the 17th Ordinance to the Federal Immission Control Act, as a waste incineration plant we are obliged to publish all emission values annually.
| Pollutant | Limit value | Line 1 | Line 2 | Line 3 | Line 4 | Mean value of all lines |
|---|---|---|---|---|---|---|
| mg/m³ tr.;n;11 V.-%O2 | mg/m³ tr.;n;11 V.-%O2 | mg/m³ tr.;n;11 V.-%O2 | mg/m³ tr.;n;11 V.-%O2 | mg/m³ tr.;n;11 V.-%O2 | mg/m³ tr.;n;11 V.-%O2 | |
| NO₂ | 150 | 136,39 | 137,44 | 134,51 | 138,72 | 136,77 |
| SO₂ | 40 | 5,45 | 4,78 | 0,62 | 5,44 | 4,07 |
| CO | 50 | 3,32 | 5,54 | 1,30 | 18,12 | 7,07 |
| C Total | 10 | 0,68 | 0,58 | 0,77 | 0,39 | 0,61 |
| HCI | 8 | 0,36 | 0,32 | 0,29 | 0,03 | 0,25 |
| Staub | 5 | 0,55 | 0,00 | 0,09 | 0,12 | 0,19 |
| Hg | 0,010 | 0,000420 | 0,000149 | 0,000013 | 0,000649 | 0,0003078 |
| NH₃ ** | 10 | 0,55 | 0,30 | 0,07 | 0,59 | 0,38 |
| PCDD/F as TE* | 0,00000010 | < 0,000000001 | < 0,000000001 | < 0,000000001 | < 0,000000001 | < 0,000000001 |
| Total Cd/TI* | 0,05 | < 0,0001 | < 0,0001 | 0,0001 | < 0,0001 | < 0,0001 |
| Sb to Sn* | 0,5 | 0,000 | 0,000 | 0,000 | 0,000 | 0,000 |
| HF* | 1,0 | < 0,001 | < 0,001 | < 0,001 | < 0,001 | < 0,001 |
| Sum As to Cr and B(a)P* | 0,05 | 0,000 | 0,000 | 0,000 | 0,000 | 0,000 |
* Pollutant (group) not measured continuously, therefore assumption of the maximum measured value plus the expanded measurement uncertainty for spot measurements
** only internal measurement; no transmission of the values via remote emission monitoring to the Düsseldorf district government.